 Data Envelopment Analysis, also known as DEA, is a non-parametric method for performing frontier analysis. It uses linear programming to estimate the efficiency of multiple decision-making units and it is commonly used in production, management and economics. The technique was first proposed by Charnes, Cooper and Rhodes in 1978 and since then it became a valuable tool for estimating production frontiers.
Update: The Datumbox Machine Learning Framework is now open-source and free to download. Check out the package com.datumbox.framework.algorithms.dea to see the implementation of Data Envelopment Analysis in Java.
When I first encountered the method 5-6 years ago, I was amazed by the originality of the algorithm, its simplicity and the cleverness of the ideas that it used. I was even more amazed to see that the technique worked well outside of its usual applications (financial, operation research etc) since it could be successfully applied in Online Marketing, Search Engine Ranking and for creating composite metrics. Despite this, today DEA is almost exclusively discussed within the context of business. That is why, in this article, I will cover the basic ideas and mathematical framework behind DEA and in the next post I will show you some novel applications of the algorithm on web applications.
Data Envelopment Analysis is a method that enables us compare and rank records (stores, employees, factories, webpages, marketing campaigns etc) based on their features (weight, size, cost, revenues and other metrics or KPIs) without making any prior assumptions about the importance or weights of the features. The most interesting part of this technique is that it allows us to compare records comprised of multiple features that have totally different units of measurement. This means that we can have records with features measured in kilometers, kilograms or monetary units and still be able to compare, rank them and find the best/worst and average performing records. Sounds interesting? Keep reading.
As we discussed earlier, DEA is a method which was invented to measure productivity in business. Thus several of its ideas come from the way that productivity is measured in this context. One of the core characteristics of the method is the separation of the record features into two categories: input and output. For example if we measure the efficiency of a car, we could say that the input is the liters of petrol and the output is the number of kilometers that it travels.
In DEA, all features must be positive and it is assumed that the higher their value, the more their input/output is. Additionally Data Envelopment Analysis assumes that the features can be combined linearly as a weighted sum of non-negative weights and form a ratio between input and output that will measure the efficiency of each record. For a record to be efficient it must give us a “good” output relative to the provided input. The efficiency is measured by the ratio between output and input and then compared to the ratio of the other records.
What we covered so far is a common sense/practice. We use input and outputs, weighted sums and ratios to rank our records. The clever idea of DEA is in the way that the weights of the features are calculated. Instead of having to set the weights of the features and deciding on their importance before we run the analysis, the Data Envelopment Analysis calculates them from the data. Moreover the weights are NOT the same for every record!
Here is how DEA selects the weights: We try to maximize the ratio of every record by selecting the appropriate feature weights; at the same time though we must ensure that if we use the same weights to calculate the ratios of all the other records, none of them will become larger than 1.
The idea sounds a bit strange at the beginning. Won’t this lead to the calculation of differently weighted ratios? The answer is yes. Does not this mean that we actually calculate differently the ratios for every record? The answer is again yes. So how does this work? The answer is simple: For every record, given its characteristics we try to find the “ideal situation” (weights) in which its ratio would be as high as possible and thus making it as effective as possible. BUT at the same time, given this “ideal situation” none of the output/input ratios of the other records should be larger than 1, meaning that they can’t be more effective than 100%! Once we calculate the ratios of all records under each “ideal situation”, we use their ratios to rank them.
So the main idea of DEA can be summed in the following: “Find the ideal situation in which we can achieve the best ratio score based on the characteristics of each record. Then calculate this ideal ratio of each record and use it to compare their effectiveness”.
Let’s see an example where we could use DEA.
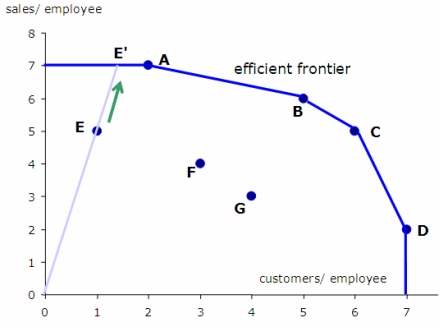
Suppose that we are interested in evaluating the efficiency of the supermarket stores of a particular chain based on a number of characteristics: the total number of employees, the size of store in square meters, the amount of sales that they generate and the number of customers that they serve every month on average. It becomes obvious that finding the most efficient stores requires us to compare records with multiple features.
To apply DEA we must define which is our input and output. In this case the output is obviously the amount of sales and the number of customers that they serve. The input is the number of employees and the size of the store. If we run DEA, we will estimate the output to input ratio for every store under the ideal weights (as discussed above). Once we have their ratios we will rank them according to their efficiency.
Now that we got an intuition of how DEA works, it’s time to dig into the maths.
The efficiency ratio of a particular record i with x input and y output (both feature vectors with positive values) is estimated by using the following formula:
![]()
Where u and v are the weights of each output and input of the record, s is the number of output features and m is the number of input features.
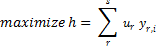
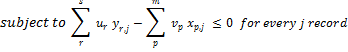
The problem of finding the best/ideal weights for a particular record i can be formulated as follows:
![]()
![]()
![]()
Again the above is just the mathematical way of finding the weights u and v that maximize the efficiency of record i, provided that those weights will not make any of the other records more efficient than 100%.
To solve this problem we must use linear programming. Unfortunately linear programming does not allow us to use fractions and thus we need to transform the formulation of the problem as following:
![]()
![]()
We should stress that the above linear programming problem will gives us the best weights for record i and calculate its efficiency under those optimal weights. The same must be repeated for every record in our dataset. So if we have n records, we have to solve n separate linear problems. Here is the pseudocode of how DEA works:
ratio_scores = [];
for every record i {
    i_ratio = get_maximum_effectiveness();
    ratio_scores[i] = i_ratio;
}
DEA is a great technique but it has its limitations. You must understand that DEA is like a black box. Since the weights that are used in the effectiveness ratio of each record are different, trying to explain how and why each score was calculated is pointless. Usually we focus on the ranking of the records rather than on the actual values of the effectiveness scores. Also note that the existence of extremums can cause the scores to have very low values.
Have in mind that DEA uses linear combinations of the features to estimate the ratios. Thus if combining them linearly is not appropriate in our application, we must apply transformations on the features and make them possible to be linearly combined. Another drawback of this technique is that we have to solve as many linear programming problems as the number of records, something that requires a lot of computational resources.
Another problem that DEA faces is that it does not work well with high dimensional data. To use DEA the number of dimensions d = m + s must be significant lower than the number of observations. Running DEA when d is very close or larger than n does not provide useful results since most likely all the records will be found to be optimal. Note that as you add a new output variable (dimension), all the records with maximum value in this dimension will be found optimal.
Finally we should note that in the general form of the algorithm, the weights of the features in DEA are estimated from the data and thus they don’t use any prior information about the importance of features that we might have in our problem (of course it is possible to incorporate this information as constrains in our linear problem). Additionally the efficiency scores that are calculated are actually the upper limit efficiency ratios of each record since they are calculated under “ideal situations”. This means that DEA can be a good solution when it is not possible to make any assumptions about the importance of the features but if we do have any prior information or we can quantify their importance then using alternative techniques is advised.
In the next article, I will show you how to develop an implementation of Data Envelopment Analysis in JAVA and we will use the method to estimate the popularity of web pages and articles in social media networks.
If you like the article, take a moment to share it on Twitter or Facebook. 🙂
My name is Vasilis Vryniotis. I'm a Machine Learning Engineer and a Data Scientist. Learn more


Datumbox offers an open-source Machine Learning Framework and an easy to use and powerful API.
Subscribe to our newsletter and get our latest news!
2013-2024 © Datumbox. All Rights Reserved. Privacy Policy | Terms of Use


Hi Andrew,
Thanks for the feedback. I’ll try to clear things up.
The Input and Output terms are regularly used in the context of DEA. This is because DEA can be applied in cases where we don’t measure costs and revenues. Such an example could be the evaluation of the efficiency of hospitals where the input is doctors and nurses and the output is patients. Also in my next post you will see such a case where we don’t even actually have an input.
Let me also explain what I mean with “black box”. What you must have in mind when you use DEA is that the efficiency scores of each record/unit is estimated with different weights. What those weights represent? Basically the importance of each feature. So what we have at the end of the analysis is a score for each record under different conditions (aka different weights). In each case, those weights are selected to maximize the efficiency of the record and thus it can be considered as the upper limit of the efficiency of the record. Since the score is the maximum value of the Linear Programming Problem, it is not always simple to explain why the record received the score. If you want to interpret it, you must check the weights that maximized its score and try to understand in which sense and under what condition this record receives the score.
DEA is used in cases when you have no idea about the importance of the features or when it does not make sense to make assumptions about their weights. For example in the context of the hospital, what is more important input the nurses or the doctors? Or when you evaluate the performance of a store, what is more important the revenues or the number of served customers? These are examples when the features can not be compared directly, you can’t construct a composite score of yourown that makes sense and this is exactly when you use DEA.
I hope this clarifies the matter a bit and not the opposite. My next article will conclude the DEA tutorial by giving an example and providing the JAVA code that solves it.
If you have any other comments, shoot them 🙂
Edit: BTW in the article, I link to the original article. The math that I provide in the article are the same, but for more details you can refer to it.
Hi,
thank you for the nice article, and the clear explanation.
but i am wondering how to get a data sets that uses the DEA.
could you please give me a link to get such data sets.
thanks.
Hi
i would lik to know how to calculat the efficiency point in DEA method
let consider the following simple example
input1 input 2 output
School 1 5 4 12
School 2 3 5 13
School 3 4 4 14
School 4 7 4 14
how pratically to calculate ?
thank you